Getting Started
Everything you need to set up QuantKit Visor and start analyzing 0DTE options data.
About QuantKit Visor
Visor is a real-time options analytics terminal that plugs directly into your Interactive Brokers data feed, surfacing options flow and dealer positioning as it happens.
Designed to give futures and options daytraders a clear edge, gamma exposure, and options structure in a single, streamlined workspace.
Every session is captured for full replay, so nothing gets missed and every setup can be reviewed.
Visor helps you understand where market makers are hedging, identify key strike levels, and see how volatility, gamma, vanna, charm and delta forces shape intraday price action — all in a clean, purpose-built interface.
Requirements
System Requirements
| Component | Requirement |
|---|---|
| Operating System | Windows 10 or later (We recommend Windows 11) |
| Processor | Any modern CPU (2015+) |
| Memory | 4 GB RAM minimum |
| Storage | 500 MB free disk space |
| Internet | Stable connection required for live data |
Software Requirements
- Interactive Brokers account — A funded or paper trading account with IBKR
- TWS or IB Gateway — Either Trader Workstation (TWS) or IB Gateway must be installed and running
- API enabled — The IBKR API must be enabled in your TWS/Gateway settings (see Connecting to IBKR)
Data Requirements
- US Securities Snapshot and Futures Value Bundle — Required for real-time future price scale conversion and future options contracts (ES/NQ/CL)
- US Equity and Options Add-On Streaming Bundle — Required for streaming option data (Indices / ETF)
💡 Note
These market data subscriptions are managed through your IBKR account, not through QuantKit. You can subscribe via Account Management > Market Data Subscriptions on the IBKR website.
Download & Installation
Finding Your License
After purchasing QuantKit Visor on Whop, your license key will be available in your Whop Quantkit dashboard under the Software section.
Installation
- Download the latest Visor installer from here: Visor latest.
- Run the installer. Windows SmartScreen may show a warning since the app is new — click "More info" then "Run anyway" to proceed.
- Follow the installation wizard to complete the setup.
⚠️ Windows SmartScreen
Since QuantKit Visor is a new application, Windows SmartScreen may flag it as unrecognized. This is normal for newly published software. Click "More info" → "Run anyway" to install.
First Launch & License Activation
- Launch QuantKit Visor after installation.
- Enter your license key from Whop when prompted.
- The application will verify your license and activate your copy.
✨ Sample Data
Don’t have IBKR set up yet? You can download sample data to explore the interface and familiarize yourself with the charts before connecting to a live feed.
Once activated, proceed to Connecting to IBKR to set up your API connection.
Connecting to IBKR
Set up the API connection between QuantKit Visor and Interactive Brokers via TWS or IB Gateway.
IBKR API Requirements
IBKR provides two distinct API connection methods for QuantKit Visor: TWS (Trader Workstation) and IB Gateway. Both offer identical data access — choose based on your workflow preferences.
💡 Note
TWS and Gateway connect on different ports by default. If you switch between them, remember to update the port in Visor’s settings.
TWS Setup
- Open TWS and go to: File → Global Configuration → API → Settings
- Check "Enable ActiveX and Socket Clients"
- Check "Read-Only API" for additional safety
- Note the socket port number (default: 7496 for live, 7497 for paper)
💡 Info
We recommend keeping “Read-Only API” enabled in your TWS settings for your peace of mind. Visor is strictly designed to read data only. It will never edit, manage, or interact with your account balances, orders, or positions.
IB Gateway Setup
IB Gateway is a standalone API module that comes pre-configured for connections on port 4001 for live and 4002 for demo (delayed) feed.
To adjust the port and enable “Read Only” mode, follow these steps:
- Open IB Gateway → "Configure"
- Navigate to "Settings"
- Go to "API"
- Select "Settings"
- Enable "Read-Only API" / Change the port as needed
Visor API Settings
- Find the Settings button
 at the bottom right of the interface and open the dialog.
 - At the top, set your preferred Client ID, and the same API port as your TWS/Gateway active socket. If using TWS, check the socket here: File → Global Configuration → API → Settings.
- Client ID can be changed to your liking to avoid same-ID conflicts with potential other applications.
- When API settings ready and the desired instrument symbol selected, click the "Connect" button (bottom right of the app).
✨ Tip
The Client ID just needs to be unique among all applications connecting to the same TWS/Gateway instance. If you only use Visor, the default value works fine.
Interface Guide
Learn how to navigate Visor’s interface, customize settings, and personalize your workspace.
UI Overview
The Visor interface is organized into three main areas. All 11 panels live in a fully dockable layout system.

| Area | Description |
|---|---|
| Toolbar | Panel toggles, strike range, time window, refresh rate, futures toggle, and pinned metrics |
| Charts & Panels | GEX chart (primary), Overall View sidebar, and 9 dockable analytics panels (VRP, VSP, ATM, VOL, G1%, VEX, CEX, DEX, HM) |
| Status & History Bar | Connection, instrument selector, screenshot, history export/import, settings, timeline slider, and status information |
✨ Tip
You can read a detailed explanation of the metrics in the Overall View panel by simply hovering your mouse over the desired row.
Docking System
All panels support full docking flexibility:
- Dock anywhere — left, right, top, bottom, or nested within other docks
- Tab groups — drop a panel onto another to create tabs
- Floating windows — drag a panel outside the window to float it (resizable from all edges)
- Maximize / restore — double-click header to expand a panel to full dock area
- Compact / detailed toggle — per-panel mode switch between metrics-only and chart view
- State persistence — entire layout (positions, sizes, tab groups) saved and restored across sessions
✨ Tip
You can resize the application window freely. The chart and all UI elements will adapt responsively.
Toolbar Controls
The top toolbar provides quick access to frequently adjusted settings.
Analytics Panels
The left side of the toolbar contains colored toggle buttons that show or hide each analytics panel. Click any panel below to see a preview.
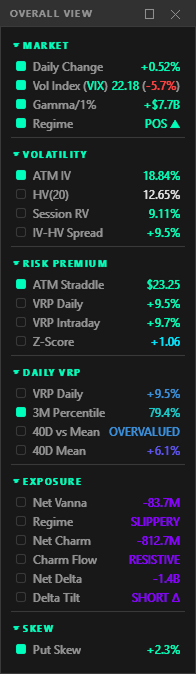
Consolidated sidebar with combined metrics from all panels (Checkboxes allows user to pin the desired metrics to the top bar for quicker access)
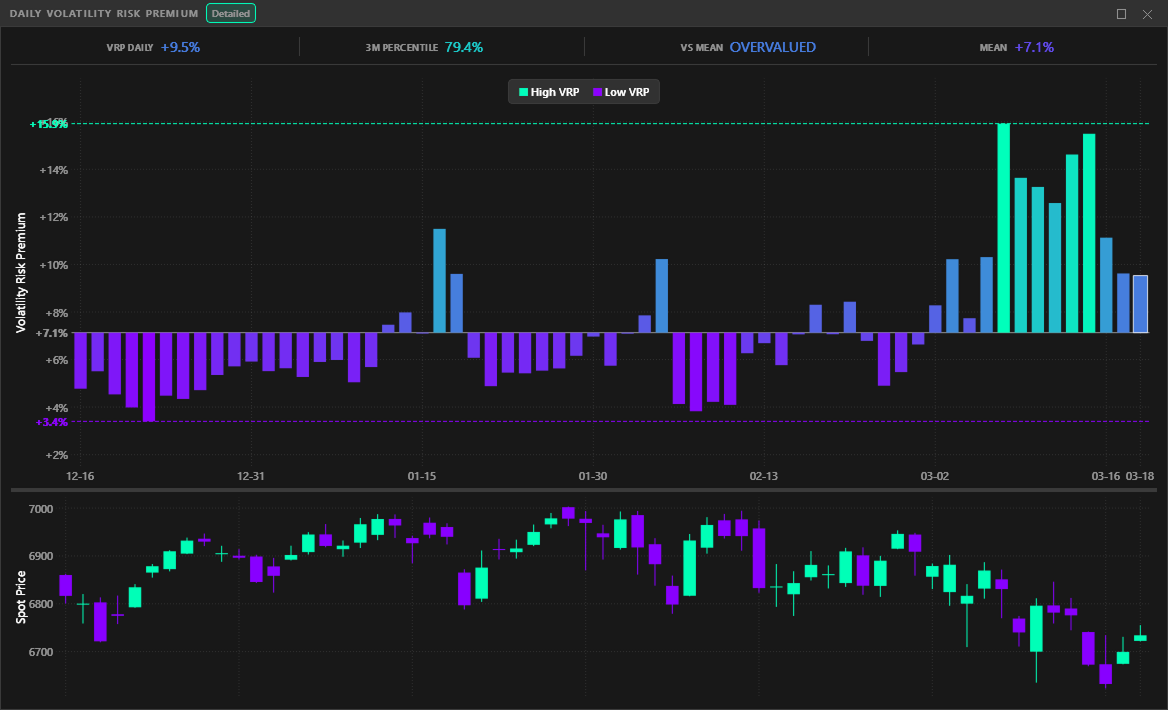
Daily volatility risk premium with 3-month percentile ranking, helping gauge whether current premium is elevated or compressed.
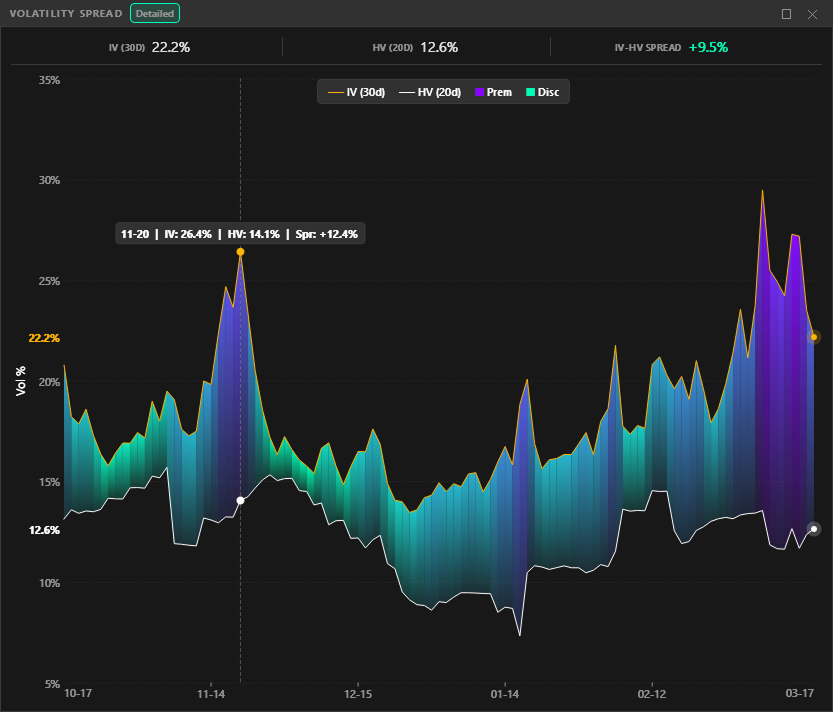
IV vs HV spread with premium and discount zones, tracking whether options are over or underpriced relative to realized moves.
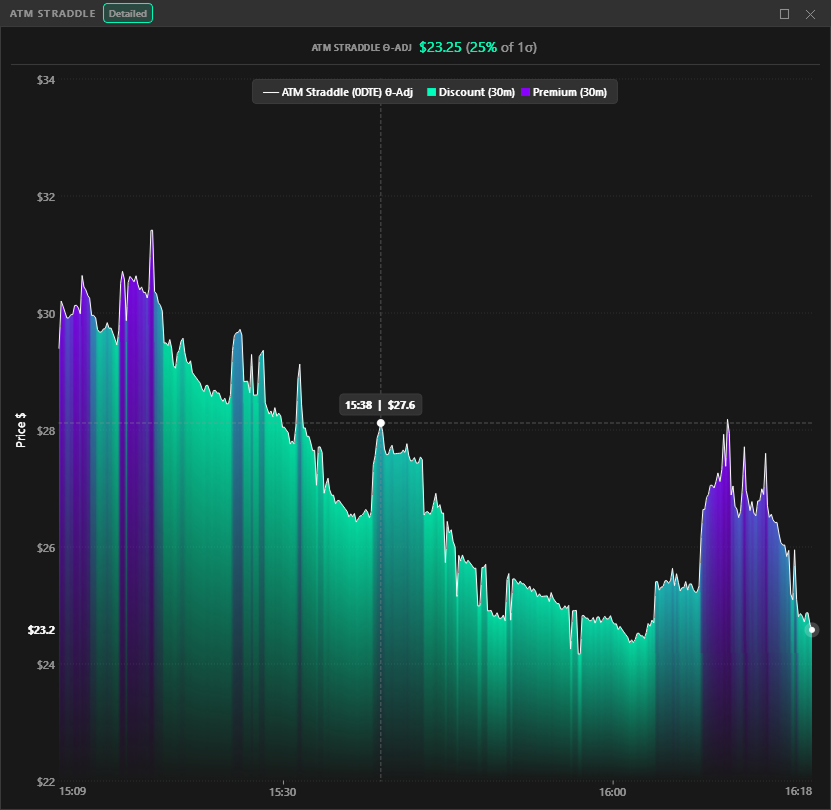
0DTE ATM straddle pricing tracked in real-time against expected move bounds with premium and discount shading.
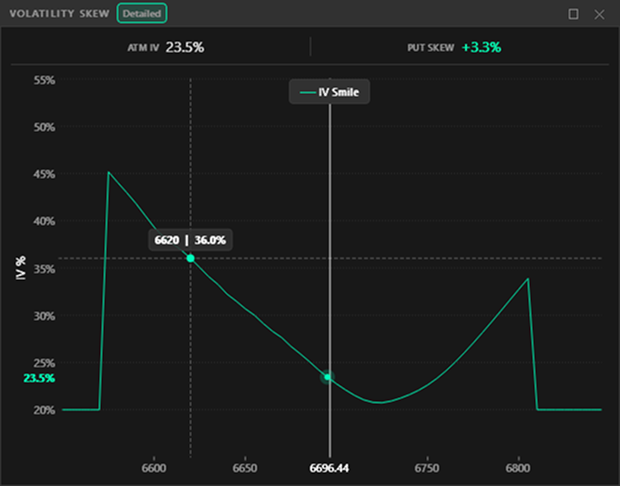
Real-time volatility skew curve with ATM implied volatility and put skew metrics across strikes.
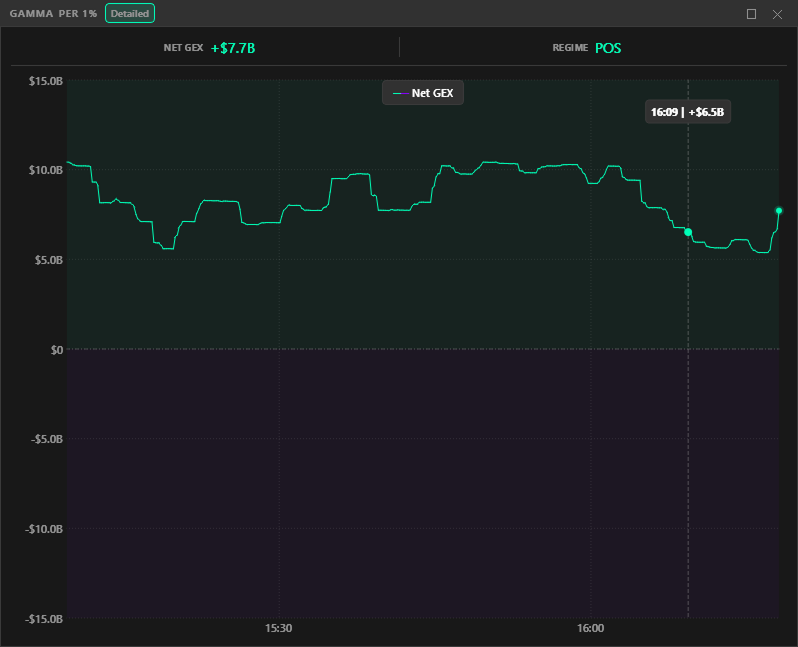
Aggregate net gamma over time with automatic regime detection, showing whether dealers are supporting or accelerating price.
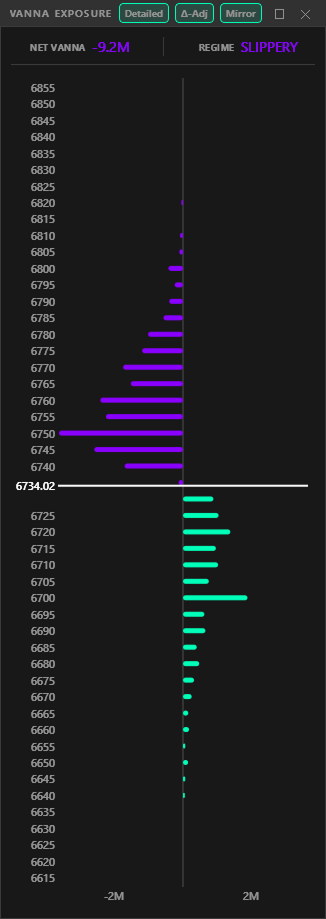
Vanna exposure by strike with flow classification, showing how IV changes translate into directional dealer hedging.
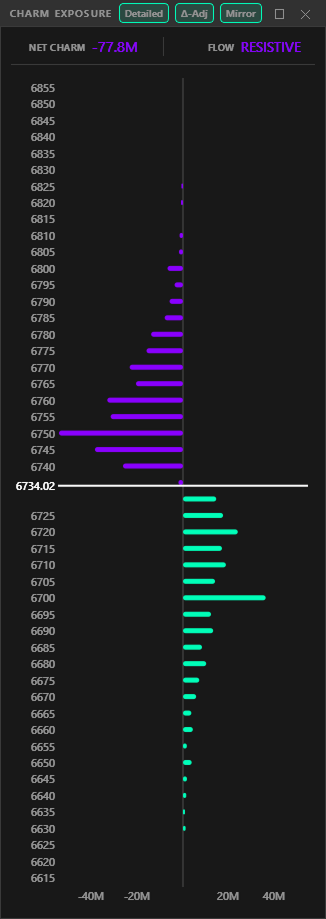
Charm exposure by strike with decay flow analysis, capturing how time decay shifts dealer positioning intraday.
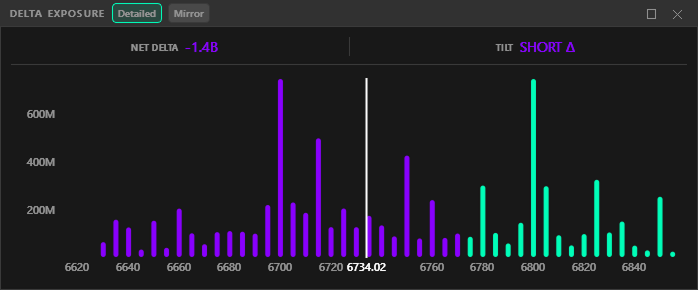
Net delta positioning by strike, highlighting directional dealer exposure and tilt across the options chain.
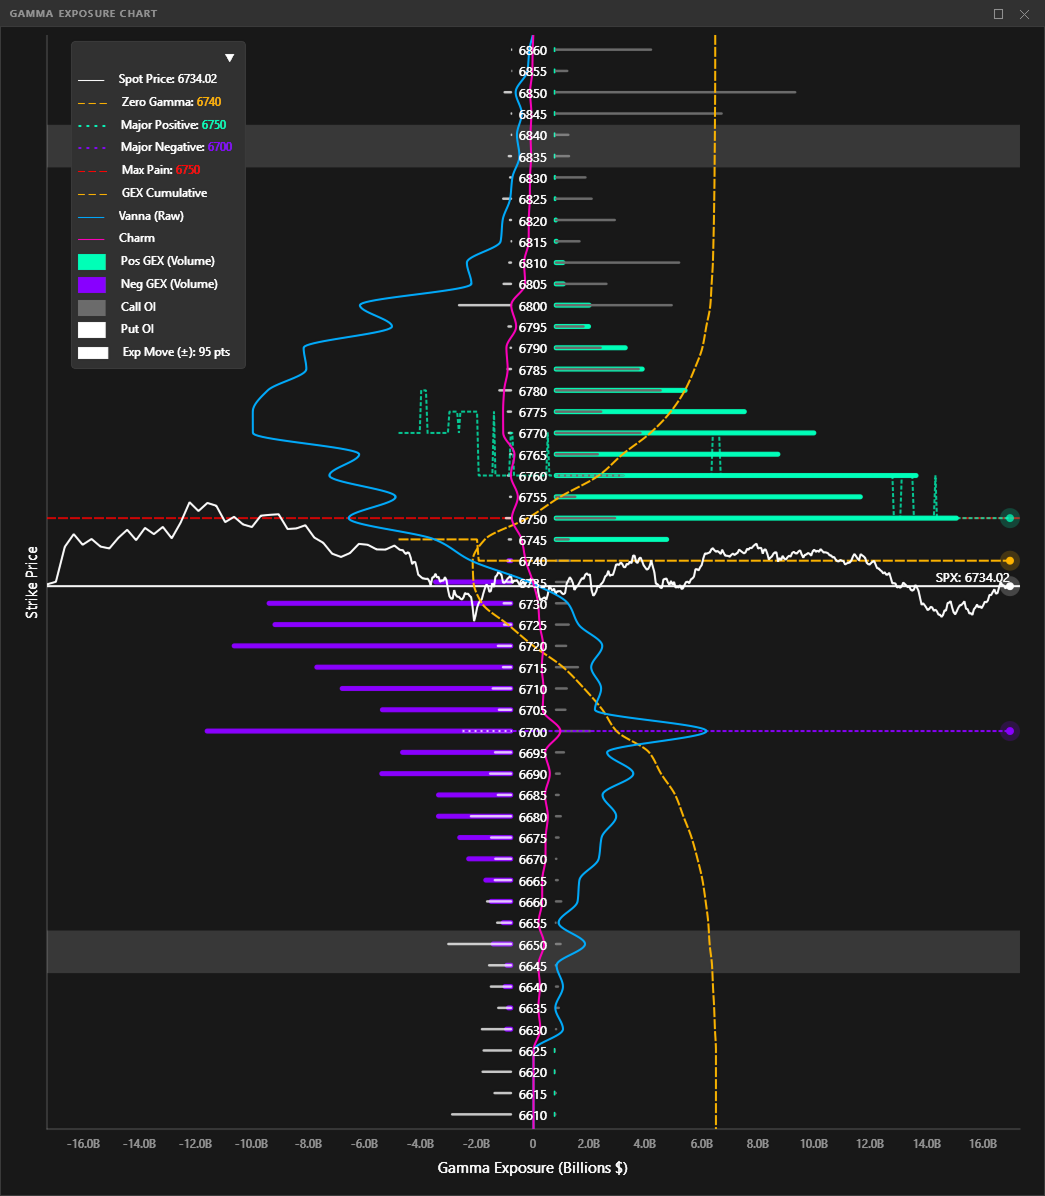
Per-strike gamma exposure with zero gamma, max pain, call/put walls, and expected move bounds overlaid in real-time.
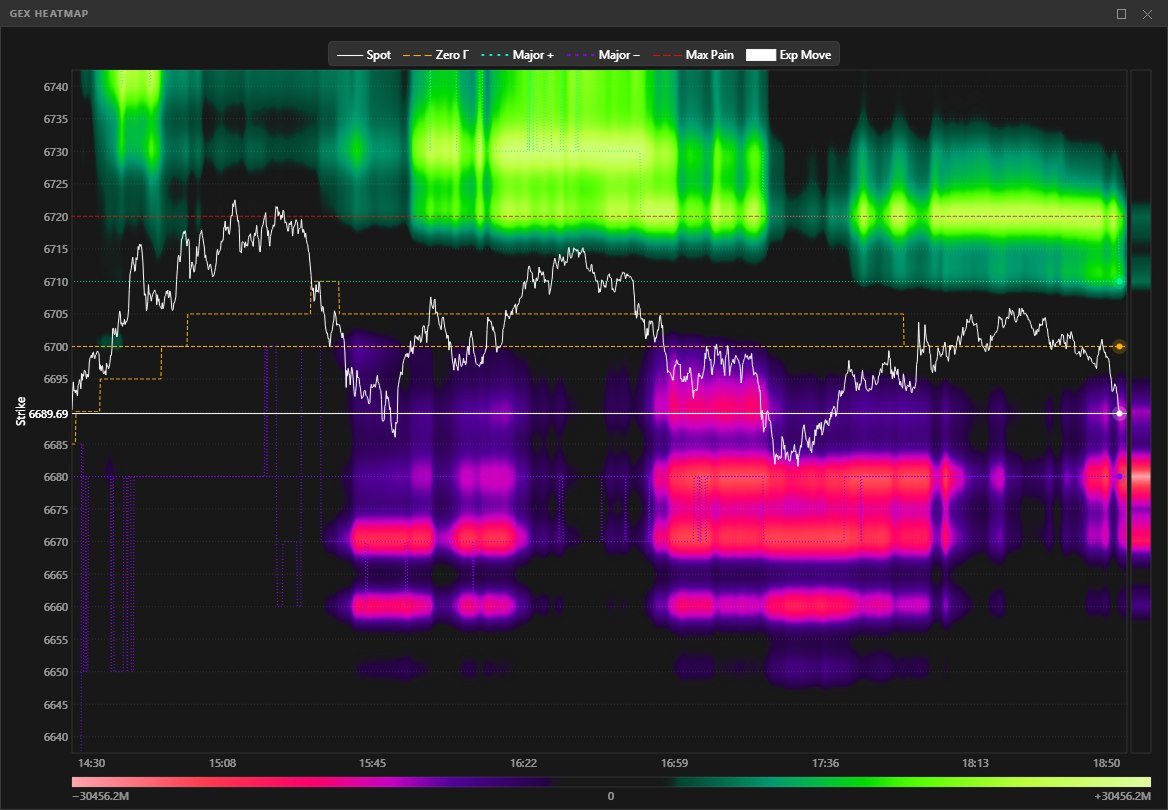
2D heatmap of gamma positioning across strikes and time, showing how dealer exposure evolves throughout the session.
Settings & Filters
| Control | Description |
|---|---|
| Strike Range | Slider (10–60 strikes in steps of 10) — how many strikes are visible around spot |
| Time Window | Filter charts to show only recent data (30min / 1h / 2h / 4h / Full Day) |
| Refresh Rate | How often the data pipeline runs (Streaming / 1s / 2s / 5s / 10s / 30s / 60s) |
| Futures Toggle | One-click toggle to view all analytics on the associated futures price scale |
| Link Button | When linked, all panels share the toolbar’s strike range and time window. When unlinked, each panel can have independent settings |
| Pinned Metrics | Live-updating pill badges dragged from the Overall View — drag to reorder, persist across sessions |
💡 Note
All sliders respond to mouse wheel for quick adjustment.
History Bar
| Element | Icon | Description |
|---|---|---|
| Replay toggle | Start/Pause session replay | |
| Replay rate | 1x | Multi click button that defines playback speed (1x/10x) |
| Go Live | Allow to switch back to live mode when connected (greyed out when disconnected) | |
| Timestamp | 16:30:00 | Timestamp of the most recent snapshot saved when live mode and of the currently viewed snapshot when in history mode |
Status Bar
| Element | Icon | Description |
|---|---|---|
| Control Bar toggle |  |
Show/hide the top toolbar |
| Timeline toggle |  |
Show/hide the history slider |
| Screenshot |  |
Capture main window as PNG |
| Export History |  |
Save current session database to file |
| Load History |  |
Import external session database for playback |
| Settings | |
Open settings dialog |
| Instrument Selector | SPX ▼ | Switch between supported instruments (categorized dropdown) |
| Connection button | Connect | Connect / Cancel / Disconnect — 3-way toggle with non-blocking cancel |
Futures Price Conversion
One-click toggle to view all index-based analytics on the associated futures price scale. This is essential for traders who watch futures (ES, NQ, CL) but need SPX/NDX gamma analytics.

| Feature | Detail |
|---|---|
| Same-scale pairs | SPX/ES, RUT/RTY, NDX/NQ, ESTX50/FESX |
| Cross-scale pairs | SPY/ES (~10x), QQQ/NQ, IWM/RTY, GLD/GC, SLV/SI |
| Drift gauge | Toolbar indicator showing real-time divergence between locked conversion ratio and live ratio |
| Resync | When drift grows too large, click Resync to recalibrate the basis spread between index and futures contract scale. Only available in live mode but baked into history for replay |
| Affected panels | GEX Chart, GEX Heatmap, Vanna, Charm, Delta, Vol Skew — each shows a “Futures” pill when active |
| Works in history | Futures scale persisted to database, replayed correctly during history scrubbing |
💡 Note
The drift gauge updates in real-time. Especially handy for ES daytraders who want to analyze SPX gamma levels without manual conversions.
Settings & Themes
The settings dialog has two tabs: General and Appearance. All changes preview live.
General Tab
API Connection
Configure your IBKR connection. See Connecting to IBKR for a detailed setup guide.
| Setting | Description |
|---|---|
| Client ID | Unique identifier (1–32767), must be unique among all apps connecting to the same TWS/Gateway |
| Port | Must match your TWS/Gateway socket port (TWS: 7496/7497, Gateway: 4001/4002) |
| Market Data Line Limit | Number of concurrent market data subscriptions (50–150, default 100) |
Chart Display
| Setting | Description |
|---|---|
| Grid Opacity | Background grid visibility (0–50%) |
| Line Thickness | Curve & Levels lines weight (1–3px) |
| Bar Thickness | Charts bar width (2–12px) |
| Rounded Bar Caps | Toggle rounded vs flat bar ends |
| Legend Scale | Scale legend text for different monitor sizes (1.0x–2.0x) |
Application
| Setting | Palette | Description |
|---|---|---|
| Always on Top | Keep Visor window above all other windows | |
| Reset UI | Restore all panel positions, sizes, and tab groups to factory defaults | |
| Theme selector — 7 built-in themes | ||
| QuantKit (default) | Classic dark gray with cyan/mint accents | |
| Foundry | Industrial dark with warm orange/coral accents | |
| Forest | Deep woodland greens with mint/coral palette | |
| Marine Blue | Deep ocean with sky blue/aqua accents | |
| Obsidian | Purple-black with soft violet accents | |
| Monochromatic | Pure grayscale — colorblind-accessible | |
| Light | Warm muted paper — the only light theme | |
Appearance Tab
Each element has a color swatch (HSV picker), alpha slider, and optional line style selector (solid/dash/dot/dashdot).
| Group | Elements |
|---|---|
| Global | Spot Price, Positive Data, Negative Data, Normal/Elevated/Alert metric level colors |
| GEX Chart & Heatmap | Zero Gamma, Major Positive, Major Negative, Max Pain, Cumulative Gamma Curve, Vanna Curve, Charm Curve, Call OI, Put OI, Expected Move |
| Panel Charts | IV Line, HV Line, IV Premium/Discount fill, Straddle Line/Cheap/Expensive, IV Skew, VRP Overvalued/Undervalued |
GEX level elements also have a display mode toggle: H-Line (horizontal level), Path (timeseries history), or Both.
Heatmap Customization
| Setting | Range | Effect |
|---|---|---|
| Sensitivity | 0–100 | Color intensity threshold (higher = more contrast) |
| Luminosity | 0–100 | Overall brightness |
| Blur | 0–100 | Gaussian smoothing (higher = smoother transitions) |
| Glow | 0–100 | Hue shift intensity at peak values |
| Posterize | 0–100 | Discrete color banding (0 = smooth, higher = incremental transition added) |
Legend & Customization
Every panel displays a legend reflecting its active elements. Colors shown in all legends update automatically when you customize them in Settings → Appearance (live preview — changes apply instantly; cancel reverts). You can also adjust the legend scale (1.0x–2.0x) in Settings → Chart Display to fit different monitor sizes.
The GEX Chart & Heatmap legend is interactive — you can:
- Click any legend item to toggle its visibility on the chart
- Choose display mode per element: H-Line (horizontal level), Path (timeseries history), or Both
Per-element color overrides persist independently of the active theme. Switching themes resets chart colors to that theme’s defaults, but your customizations can be re-applied.
Understanding the Data
⚠️ Important — Data & Model Assumptions
QuantKit Visor computes options analytics from brokerage-level market data (Interactive Brokers), not institutional order flow feeds. Key differences to understand:
No trade direction. Brokerage data provides price, volume, and open interest — but not who is buying or selling. Dealer positioning (long/short gamma) is inferred using the industry-standard assumption that dealers are net short options against customer flow. This is the same framework used by similar platforms that usually charges 50/70$ for it.
Model-derived greeks. Implied volatility and greeks are computed via the Black-Scholes-Merton pricing model through IBKR’s engine. Institutional desks may use proprietary models with additional inputs (flow data, skew surfaces, inventory). Our outputs are analytically sound but represent a model estimate, not observed dealer books.
Especially relevant for 0DTE. While open interest is settled end-of-day (a universal limitation), 0DTE options expire the same session — meaning intraday volume effectively is the live positioning. There is no stale overnight OI to worry about. This makes gamma exposure profiles particularly accurate for same-day expiration trading, where the bulk of retail and institutional hedging activity concentrates.
A complete guide to reading and interpreting the charts and metrics displayed in Visor.
GEX Chart — The Primary Panel
The GEX chart is the core visualization — a per-strike gamma exposure bar chart with multiple overlays showing where dealer hedging pressure concentrates and how it shifts in real-time.
GEX Bars
Per-strike net gamma exposure. The calculation assumes dealers take the opposite side of customer flow (industry-standard convention).
| Bar Direction | Meaning |
|---|---|
| Positive (above zero) | Call-dominated strikes — dealers’ hedging creates a pinning effect, price tends to stabilize |
| Negative (below zero) | Put-dominated strikes — dealers’ hedging amplifies moves in the same direction as price |
Key Levels
| Level | Description |
|---|---|
| Max Positive | Strike with highest positive GEX — resistance proxy. Shifts throughout the session as new volume accumulates |
| Max Negative | Strike with most negative GEX — support proxy. Same dynamic behavior as call wall |
| Zero Gamma | Strike where cumulative gamma curve reaches its minimum — the regime flip point |
| Max Pain | Strike minimizing total option payout at expiration |
| Expected Move | 1-sigma daily range derived from vol index. The ATM Straddle amount represent a dynamic and more precise pricing of this expected move in realtime. |
Cumulative GEX Curve
Running sum of net gamma from lowest to highest strike, revealing the aggregate dealer positioning profile.
- Rising slope — Positive gamma accumulating = stabilizing hedging dominates
- Falling slope — Negative gamma accumulating = amplifying hedging dominates
- The minimum point defines the Zero Gamma level
Gamma Regime
Determined by spot price position relative to zero gamma:
- Positive regime (spot above zero gamma) — Mean-reverting. Dealers sell rallies, buy dips
- Negative regime (spot below zero gamma) — Trending. Dealers chase price, amplifying momentum
✨ Tip
Zero Gamma is often a volatile area with rejection above and below — a price zone that traps impatient traders and gets revisited many times on balanced days.
OI Bars
Open interest underlay by strike (positions from yesterday’s settlement). Right bars = calls, left bars = puts. OI is static intraday — Visor uses a synthetic OI approximation (baseline OI + cumulative intraday volume) to estimate intraday changes.
Spot Price & Price Path
Current underlying price with live tracking. When futures toggle is active, all chart elements display on the futures price scale while calculations remain index-based.
GEX Heatmap
2D strike × time thermal visualization showing how gamma exposure evolves throughout the session. Each column is a time slice, each row is a strike, and color intensity represents GEX magnitude.
- Positive GEX renders in the green spectrum, negative in the red spectrum
- Spot price path, zero gamma, call wall, and put wall positions are tracked over time
- Dashed lines mark data disconnections (gaps > 30s)
- Heatmap appearance is fully customizable in Settings → Appearance (sensitivity, luminosity, blur, glow, posterize)
Vanna Exposure (VEX)
How dealer hedging changes when implied volatility shifts. Vanna effects are conditional — they require actual IV movement to materialize (unlike charm).
- Positive vanna (below spot) — Sticky: dealer hedging supports price, creates walls
- Negative vanna (above spot) — Slippery: dealer hedging amplifies moves, acceleration
Most relevant during news events, economic data, FOMC — any catalyst that moves implied volatility.
Raw vs Delta-Adjusted toggle: Delta-adjusted weights each strike by |delta|, so ATM options (~0.5) contribute more than far OTM (~0.01). Reflects actual dealer hedging intensity more accurately.
Charm Exposure (CEX)
How dealer hedging requirements change as time passes. Unlike vanna, charm is a certainty — time always passes. Critical for 0DTE where theta accelerates exponentially.
- Positive (below spot) — Supportive: put delta decaying, dealers must buy back hedges
- Negative (above spot) — Resistive: call delta decaying, dealers must sell hedges
Same raw vs delta-adjusted toggle as vanna.
💡 Note
The 3–4 PM ET “Charm Hour” is when this effect reaches its peak. Knowing which direction dealer hedging MUST fade into the close — regardless of price action — is a significant edge.
Delta Exposure (DEX)
Net dealer directional positioning derived from Open Interest (structural positioning), not intraday volume.
- Positive — Dealers long delta at this strike
- Negative — Dealers short delta at this strike
- Net delta tilt (Long/Short) shown in compact mode
Key difference from Vanna/Charm: Uses OI for structural positioning rather than volume for intraday flow. No delta-adjusted toggle since delta IS the metric.
Net Gamma / 1% Move (G1%)
Intraday time series of aggregate net gamma across all strikes — the “pulse” of the gamma regime.
- Line is regime-colored: green when positive gamma (stabilizing), red when negative (amplifying)
- Zero crossing = gamma regime flip
- Displayed in $/1% move in compact mode
Volatility Risk Premium (VRP)
The premium traders pay for implied volatility over what the market actually realizes.
VRP Global = (Vol Index / 100) − HV(20)
- Green ≥ 0 = IV overpriced (favor selling premium)
- Red < 0 = IV underpriced (favor buying premium)
VRP Intraday = ATM IV (0DTE) − Session RV — updates in real-time throughout the session.
Z-Score = (current VRP − mean) / std VRP (from ~100-day rolling distribution)
| Z-Score | Interpretation |
|---|---|
| Z > 2.0 | Extreme — historically elevated premium |
| Z > 1.0 | Elevated — above average premium |
| Z < 1.0 | Normal range |
Full panel shows a daily VRP histogram (last ~40 trading days) centered on distribution mean, providing context for whether today’s premium is historically high or low.
Volatility Spread (VSP)
30-day implied volatility (from vol index) vs 20-day historical volatility, plotted over time with gradient crossover fill.
- Green fill when IV > HV — implied premium, options relatively expensive
- Red fill when HV > IV — implied discount, options relatively cheap
ATM Straddle (ATM)
0DTE ATM straddle price (call mid + put mid) tracked in real-time with a 30-minute rolling window gradient.
- Green zone at 30-min low = straddle cheap
- Red zone at 30-min high = straddle expensive
Theta-adjusted toggle: Subtracts expected linear decay to isolate vol-driven price moves only. Critical for 0DTE where theta acceleration distorts raw straddle readings.
IV Smile / Skew (VOL)
Call IV and Put IV plotted against strike prices — the full volatility skew structure.
Put Skew = (5% OTM Put IV / ATM IV − 1) × 100
- Measures how much more expensive downside protection is relative to ATM
- Higher put skew = more demand for downside hedging = fear premium
Always shows the full 60-strike range (not affected by toolbar strike range slider).
Overall View (OV)
Central metrics dashboard — all key values at a glance. Hover any row for a detailed explanation.
| Section | Metrics |
|---|---|
| Market | Net Gamma ($/1% move), Daily Change (%), Gamma Regime |
| Volatility | ATM IV, Vol Index, HV(20), Session RV, IV-HV Spread |
| Risk Premium | ATM Straddle, VRP Daily, VRP Intraday, Z-Score |
| Daily VRP | VRP value, 3-Month Percentile, vs Mean, 40-Day Mean |
| Exposure | Net Vanna + Regime (Sticky/Slippery), Net Charm + Flow (Supportive/Resistive), Net Delta + Tilt (Long/Short) |
| Skew | Put Skew (%) |
Key metrics are color-coded: Normal (green) / Elevated (amber) / Alert (red) based on dynamic thresholds. Any metric can be pinned to the toolbar as a live-updating pill badge.
Support & Resources
Best practices for using Visor, session management, and where to get help.
Best Practices
Daily Session Initialization
The application automatically creates a new session at 9:30 AM ET when the market opens. This is triggered when the settings window is open while connected to the API.
💡 Expected freeze: 10–30 seconds
This is normal behavior. Visor retrieves Open Interest data (a heavy operation) and initializes the new session. First connection of the day takes longer than subsequent reconnections.
Resolution: This initialization delay will be optimized in v1.0.
Data continuity: Previous session data remains visible until new data arrives.
Instance
The use of Visor is currently limited to one instance per user at a time. This is to protect user to overload API subscription.
Session Handling
Automatic Data Management
QuantKit Visor always displays the most recent trading day by default, allowing you to replay the current session at any time using the history slider.
Each trading day generates a database file (ex: Instrument_Visor_YYYY-MM-DD.db) to your local system at:
user/appdata/quantkit/historical_data/
It saves all the context with all metrics and graphic representation of the day.
Storage Management
- To optimize disk space, the application retains only the 5 most recent per instrument historical days’ data
- Older sessions are automatically deleted
- If you want to preserve specific days for replay or analysis, you can save them directly from Visor using the Save History button or simply go to your local file and copy the historical file for the day
History Slider Behavior
When connecting to API and market is open, Visor will auto switch to live mode if:
- Slider is at end position of timeline
- No historical data is imported / opened / available
History Mode: Drag slider to replay any point in the session.
Replay Mode: Play / Pause button to initiate sequence autoplay and adjust the speed with the playback rate button.
Go Live button: Appears with red dot when viewing history and live data is available.
Troubleshooting
Connection Handling
Visor handles connection issues automatically:
- Temporary disconnection — Visor attempts automatic reconnection silently
- Extended disconnection — Status bar displays connection state; manual reconnect may be required
- TWS/Gateway restart — Visor will reconnect automatically when IBKR becomes available again
Common Issues
| Issue | Solution |
|---|---|
| Can’t connect to TWS/Gateway | Verify API is enabled and port numbers match (see Connecting to IBKR) |
| No data appearing | Check your IBKR market data subscriptions are active |
| App freeze at 9:30 AM | Normal — initialization takes 10–30 seconds for OI data retrieval |
| Client ID conflict | Change the Client ID in Visor settings to avoid conflicts with other API applications |
Getting Help
WHOP Support Chat
Access instant support directly through QuantKit’s WHOP storefront.
whop.com/quantkit-software/chat → Support Chat
Discord Community
Join our Discord server for community discussions, bug reports, and feature requests.
Important: Join through your WHOP dashboard to automatically receive your verified user role.
Claim Discord access directly through QuantKit’s WHOP: whop.com/quantkit-software/discord → Claim access
Video Tutorials
Step-by-step guides for setup, features, and trading strategies.
YouTube — QuantKit Visor Tutorials
Account Management
Manage your subscription, update payment methods, or view invoices directly on WHOP.
Need to transfer? Simply reset your Software key through your QuantKit’s WHOP dashboard: whop.com/quantkit-software → Software → Reset license key
✨ Found a bug? Have a feature idea?
We’d love to hear from you. Use the #bug-reports or #feature-requests channels in Discord, or reach out via WHOP support chat.